
Harnessing
what's now.
Imagining
what's next.
Guiding, protecting, and empowering organizations along their digital journey.

")
How to gain control of your Microsoft Power Platform environment: Tools and governance
Who is using Microsoft Power Platform within your organization? Mitigate risks to your data by setting up a strong tools governance structure.
TagArticle

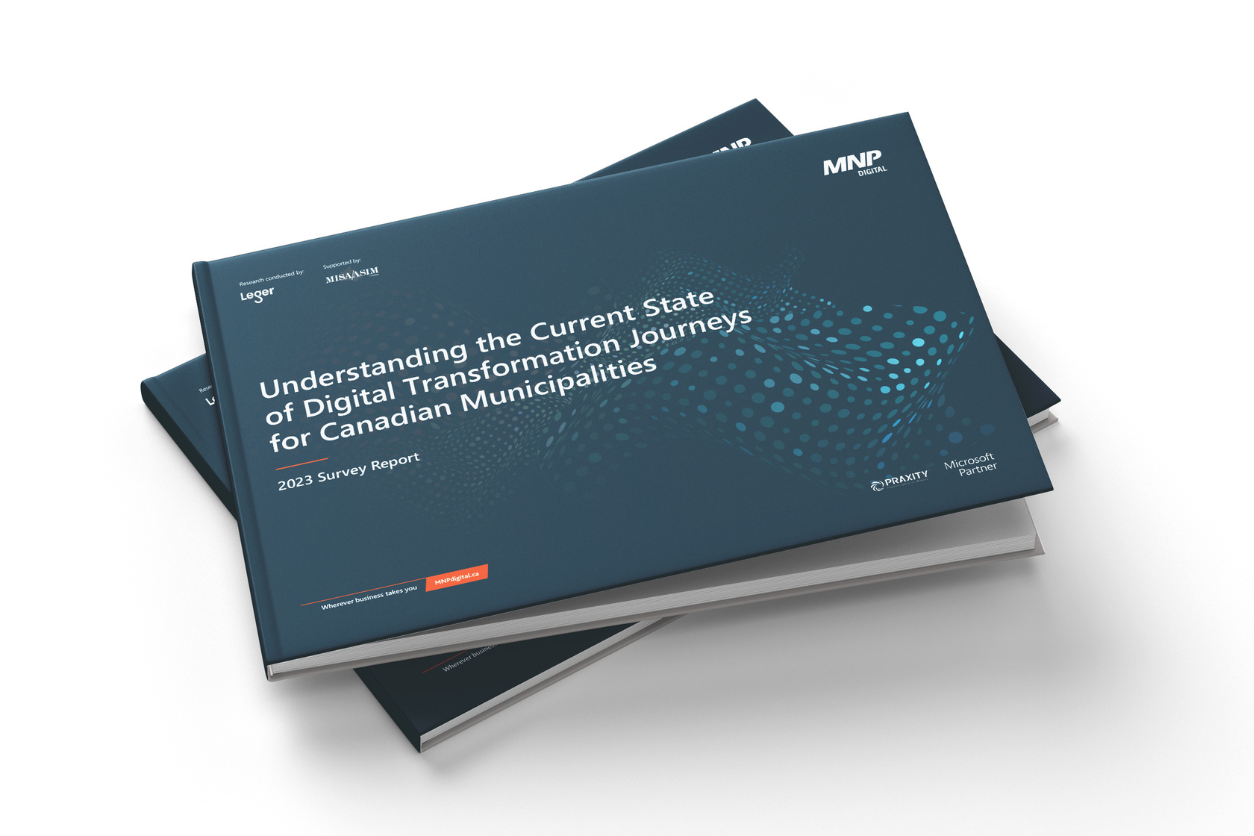
Leaving a legacy: Why local governments are quickly moving towards modern, innovative digital solutions
The role of technology within local governments has seen a significant shift in the last decade with increasing demand.

IDC low-code GenAI analyst brief
The power of low-code app development is clear – but with generative AI, organizations are leveling up in ways never thought possible. Download the analyst brief now.
")
What does your organization need to know about hiring a managed services provider to support its IT needs?
What does your business need to know about hiring a managed services provider for its IT needs? Discover insights from MSP industry pioneer John McLaughlin.
Our latest thinking
Deep insights into technology topics that matter.
What we do
We combine inspiration and expertise to deliver purpose-driven strategies and solutions.

Digital Advisory
Understand, anticipate, and accelerate with confidence.

Applied Data & Analytics
Harness your data to fuel digital transformation.

Application Development
Upgrade the way you work and captivate your customers.

Digital Platforms
Boost your growth and productivity using modern platforms and tools.

Cyber Security & Privacy
Minimize threats and proactively protect your most valuable assets.

Cloud Services
Gain efficiencies and amplify innovation by leveraging the cloud.

Small or midsized business
We have solutions tailored to your needs.

Managed IT Services
Simplify your IT operations and focus on what you do best.
In the news
MNP’s Jason MacLean wins Sitecore Most Valuable Professional award for the third time
Elite distinction awarded for commitment and dedication to the Sitecore community.

Ready to get started?
We’re always looking for new challenges and teammates.